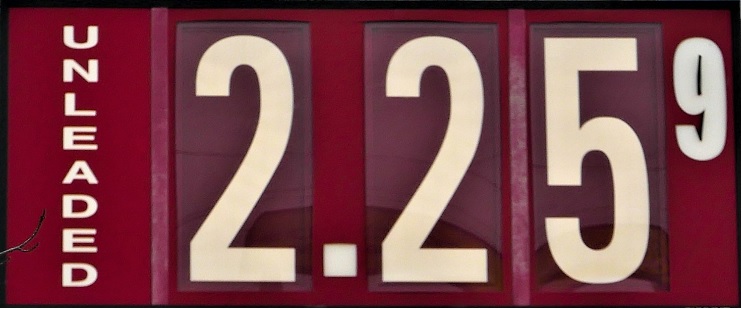
Gas prices are having the most expensive start to the year since 2014. Some Murfreesboro discounters started the week with regular gas at $2.25 per gallon. So far this year, Tennessee gas prices climbed an average of 9 cents. Last week, the state average rose 2 cents. Sunday's state average of $2.36 is 14 cents more than a month ago, and 25 cents more than this time last year.
- The most expensive gas price averages in Tennessee are in Jackson ($2.40), Nashville ($2.38), and Kingsport-Bristol ($2.37)
- The least expensive gas price averages in Tennessee are in Murfreesboro ($2.25), Chattanooga ($2.28), Cleveland ($2.31), and Clarksville-Hopkinsville ($2.31)
| JANUARY | 2014 | 2015 | 2016 | 2017 | 2018 |
| Florida | $3.38 | $2.18 | $1.92 | $2.37 | $2.47 |
| Georgia | $3.22 | $2.07 | $1.82 | $2.23 | $2.40 |
| Tennessee | $3.11 | $1.95 | $1.69 | $2.12 | $2.30 |
"It has been anything but a normal January for prices at the pump," said Mark Jenkins, spokesman, AAA - The Auto Club Group. "Normally, demand slips and supplies build. However, this story so far this year has been a rally in oil prices.
"Oil prices strung together three weeks of significant gains, raising the cost of producing gasoline," Jenkins continued. "As a result, gas prices for the month of January have been the most expensive in four years. Fortunately, prices at the pump plateaued late last week, after the momentum for oil stalled out. While gas prices will continue to be steered by the price of oil, they will soon face additional pressure from refinery maintenance season. During the next few months, refineries will reduce output as they conduct maintenance on their equipment and switch to summer-blend gasoline. This usually leads to tighter supplies and forces gas prices higher. However, there is still lingering hope that U.S. oil production will ramp-up sooner than later, which would boost inventories and push energy prices lower."
The Energy Information Administration is forecasting a resurgence of U.S. oil production this year, in response to the recent rally oil prices. The EIA forecasts that crude oil production will average 10.3 million barrels per day in 2018, which would mark the highest annual average production rate in U.S. history, surpassing the previous record of 9.6 million b/d set in 1970. If the forecast holds, it would be 1 million b/d more than last year. The EIA expects domestic production to reach 10.8 million b/d in 2019 and surpass 11 million b/d in November 2019. With output numbers like these, the U.S. would surpass Saudi Arabia and rival Russia for the world's top producer. Saudi Arabia has produced as much as 10.5 million barrels per day, but that rate has dropped below 10 million, due to the recent OPEC production cut agreement. Last year, Russia reached a 30-year high average production rate of 10.98 barrels per day.
At the close of Friday's formal trading session on the NYMEX, WTI dropped 58 cents to settle at $63.37 - almost a dollar less than the week before.
Gas Price Tools for Reporters/Consumers
- GasPrices.AAA.com - Daily national, state, and metro gas price averages.
- AAA Mobile app - Free app that shows current prices at a gas station near you.
Highs and Lows of 2017*
- National: the highest average price for gasoline was $2.67 on September 8. The lowest was $2.23 on July 5.
- Florida: the highest average price in was $2.73 on September 9. The lowest was $2.13 on July 17.
- Georgia: the highest average price was $2.76 on September 12. The lowest was $2.08 on July 5.
- Tennessee: the highest average price was $2.60 on September 10. The lowest was $1.99 on July 5.
CURRENT AND PAST PRICE AVERAGES
 |
Sunday | Saturday | Week Ago | Month Ago | One Year Ago | Highest Price on Record |
| National | $2.537 | $2.538 | $2.528 | $2.430 | $2.314 | $4.114 (7/17/2008) |
| Florida | $2.544 | $2.543 | $2.450 | $2.358 | $2.351 | $4.079 (7/17/2008) |
| Georgia | $2.446 | $2.444 | $2.426 | $2.272 | $2.215 | $4.164 (9/15/2008) |
| Tennessee | $2.357 | $2.356 | $2.335 | $2.218 | $2.113 | $4.118 (9/15/2008) |


