


In May 2021, the National Oceanic and Atmospheric Administration (NOAA) released their decennial U.S. Climate Normals data, which provides data on typical climate conditions for locations all over the U.S. The conclusions of the data are clear: in recent years, much of the United States has grown both warmer and wetter on average.
Together, warmer and wetter air produce more extreme weather events. 2019 was the wettest year in the U.S. since 1973 and saw 14 weather and climate disasters that had losses exceeding $1 billion each. In 2020, that number grew to 22—a new record, topping the previous record of 16 set in 2011 and tied in 2017.
For wet weather, these disasters often take the form of tropical cyclones, severe storms, and flooding. The past decade or so has seen a dramatic increase in the number and severity of these events. Between 1980 and 2008, the number of billion-dollar wet weather disasters exceeded five in only two years, 1992 and 1998. Since 2008, every year has had more than five disasters. And the costs have increased accordingly, with the five-year average reaching a peak of $106 billion in 2020.

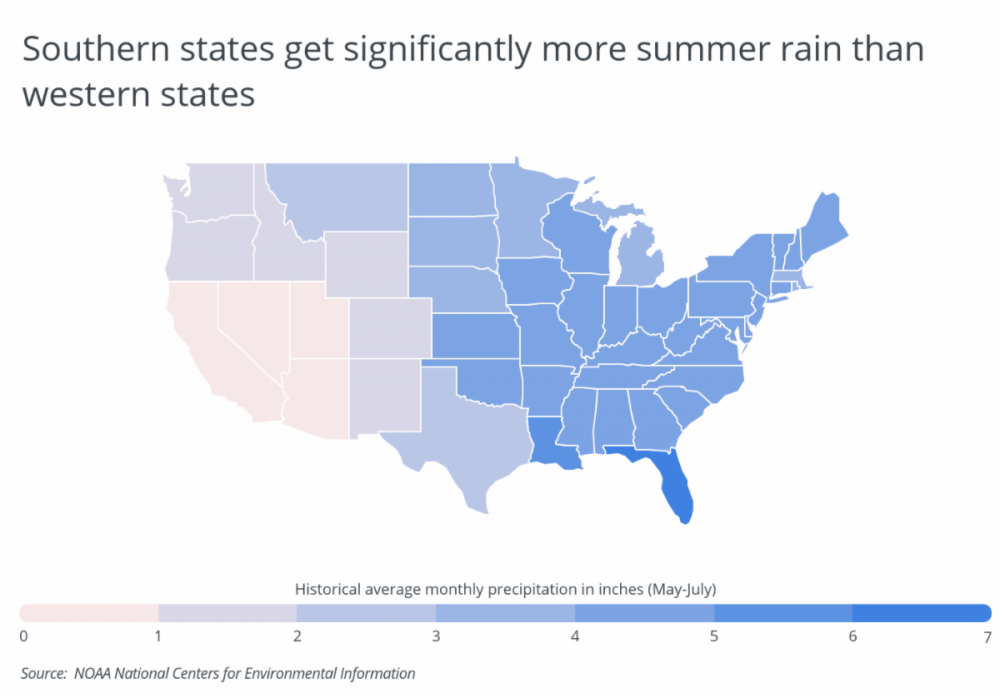
Some regions experience the effects of these trends disproportionately based on geographic and environmental factors. Much of the western U.S. is desert, where warming trends have made the region more arid, whereas the southeast is warm and humid and has gotten wetter over time.
The regional differences are especially stark around this time of year as spring transitions into summer. During the three-month period from May to July (historically, the nation’s rainiest three-month period), regular summer rains drench many states in the South, led by Florida, which experiences more than 6 inches of precipitation per month on average. In contrast, Western states like California, Nevada, and Arizona see less than an inch per month over the same period.
These trends are similar at the local level, with most of the cities that get the most summer rain being found in the South and Midwest. To find the locations that get the most rain from May to July, researchers at Porch analyzed the recently updated 1991–2020 Climate Normals dataset from NOAA’s National Centers for Environmental Information. For each location, Porch calculated the historical average monthly precipitation, the 2020 average monthly precipitation, and the historical average maximum temperature, all between May and July.
The analysis found that historically, Tennessee endures 4.77 inches of rain between May and July each year, compared to the national average of 3.02 inches. In 2020, Tennessee had 4.38 inches of rain during the same span—0.39 inches less than average. Out of the 48 contiguous U.S. states, Tennessee gets the 6th most summer rain.
Here is a summary of the data for Tennessee:
- Historical average monthly precipitation in inches (May–July): 4.77
- 2020 monthly precipitation in inches (May–July): 4.38
- 2020 difference from average in inches: -0.39
- Historical average max temperature (May–July): 83.7°F
For reference, here are the statistics for the entire United States:
- Historical average monthly precipitation in inches (May–July): 3.02
- 2020 monthly precipitation in inches (May–July): 2.92
- 2020 difference from average in inches: -0.10
- Historical average max temperature (May–July): 80.9°F
For more information, a detailed methodology, and complete results, you can find the original report on Porch’s website: https://porch.com/advice/