
In late May, the U.S. commemorated the first anniversary of George Floyd’s death, an event that set off an ongoing wave of protests, demonstrations, and other activism highlighting racial inequities and injustices in modern society. One year since this national reckoning began, much of the country has a greater understanding of how race operates to the benefit of some and exclusion of others.

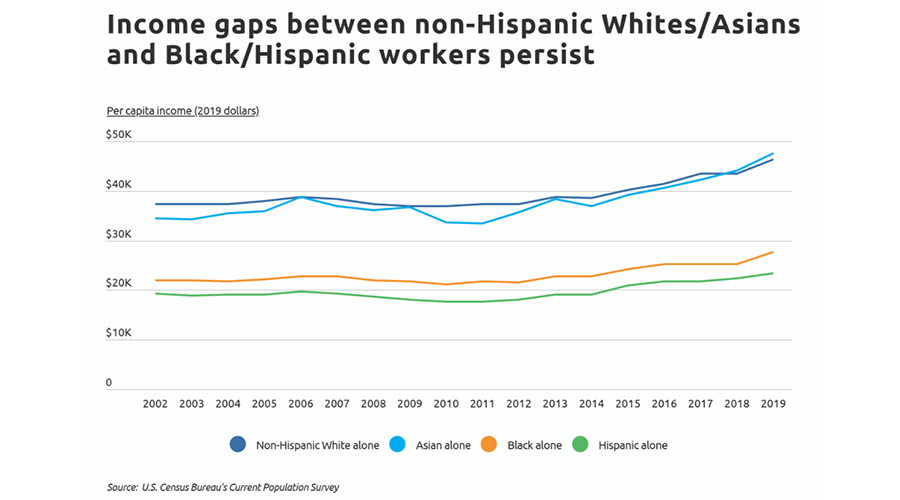
Data from the Bureau of Labor Statistics shows the persistence of the minority wage gap over time, with non-Hispanic Whites and Asians consistently out-earning Black and Hispanic workers. In 2002, per capita income was $37,234 for non-Hispanic Whites, $34,388 for Asians, $22,004 for Blacks, and $19,220 for Hispanics (in inflation-adjusted dollars). In 2019, those figures were $46,281 for Whites, $47,525 for Asians, $27,593 for Blacks, and $23,289 for Hispanics. This means that wage gaps have not only remained in place over time but in fact have grown larger as the incomes for non-Hispanic Whites and Asians rose faster than those of their Black and Hispanic peers.
Minority wage gaps are more prominent in some regions of the country than in others due to both economic and demographic factors. Some states with low incomes overall, like the Appalachian states of West Virginia, Kentucky, Arkansas, and Missouri, also have smaller wage gaps because Whites are earning less. In contrast, a state like California has some of the highest wages of anywhere in the country; however, many of the highest-earning professions in fields like tech or finance have unusually high concentrations of White workers, whereas lower-income jobs tend to be filled more by Black and Hispanic workers.
Interestingly, one geographic factor that may not necessarily affect gaps at the state level is the share of the White or non-White population in a state. For instance, states with very low non-White populations pop up on both ends of the wage gap spectrum.
To find the states with the largest wage gaps, researchers at Self used American Community Survey data from the Census Bureau to calculate the percentage difference in median annual earnings between minority and non-minority full-time workers. For the purpose of this analysis, an individual was considered to be a minority if they identified as any racial or ethnic group other than non-Hispanic White.
For context, the researchers also reported the minority and non-minority wages, minority population share, and total population for each state.
The analysis found that in Tennessee, full-time minority workers earn a median $35,000 per year, compared to the non-minority median of $45,000—or 22.2% less than non-minority workers. Out of all states, Tennessee reports the 14th smallest minority wage gap.

• Minority wage gap: -22.2%
• Median earnings for full-time minority workers: $35,000
• Median earnings for full-time non-minority workers: $45,000
• Minority population share: 26.7%
For reference, here are the statistics for the entire U.S.

• Median earnings for full-time minority workers: $40,000
• Median earnings for full-time non-minority workers: $54,000
• Minority population share: 40.0%
For more information, a detailed methodology, and complete results, you can find the original report on Self’s website: https://www.self.inc/blog/