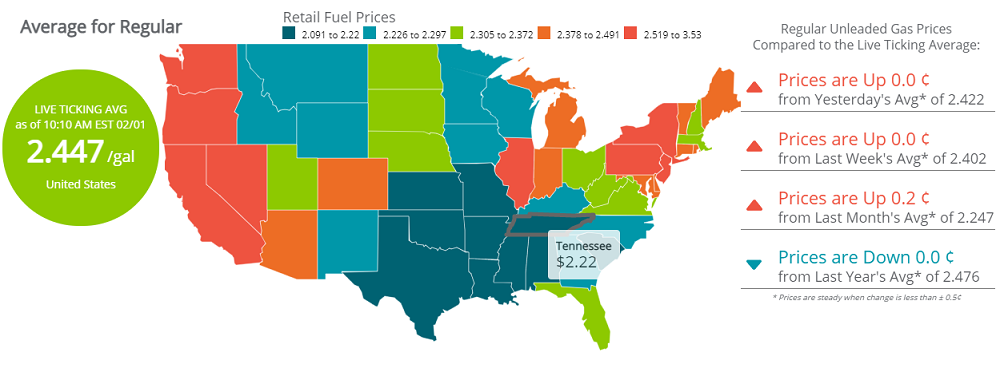
Example of Fuel Prices in Murfreesboro, TN (02/01/2021):
• Murphy Express on Memorial Blvd. - $2.14/Regular
• Speedway on S. Rutherford Blvd. - $2.15/Reg
• Kroger Fuel Center on S. Church St. - $2.30/Reg
According to GasBuddy price reports, the cheapest station in Tennessee is priced at $1.97/g today while the most expensive is $2.59/g, a difference of 62.0 cents per gallon. The lowest price in the state today is $1.97/g while the highest is $2.59/g, a difference of 62.0 cents per gallon.
The national average price of gasoline has risen 1.9 cents per gallon in the last week, averaging $2.42/g today. The national average is up 17.4 cents per gallon from a month ago and stands 5.5 cents per gallon lower than a year ago.
Historical gasoline prices in Tennessee and the national average going back ten years:
• February 1, 2020: $2.20/g (U.S. Average: $2.47/g)
• February 1, 2019: $2.01/g (U.S. Average: $2.27/g)
• February 1, 2018: $2.40/g (U.S. Average: $2.60/g)
• February 1, 2017: $2.06/g (U.S. Average: $2.27/g)
• February 1, 2016: $1.60/g (U.S. Average: $1.79/g)
• February 1, 2015: $1.89/g (U.S. Average: $2.05/g)
• February 1, 2014: $3.07/g (U.S. Average: $3.27/g)
• February 1, 2013: $3.27/g (U.S. Average: $3.47/g)
• February 1, 2012: $3.37/g (U.S. Average: $3.45/g)
• February 1, 2011: $2.93/g (U.S. Average: $3.09/g)
Neighboring areas and their current gas prices:
• Chattanooga- $2.11/g, down 1.3 cents per gallon from last week's $2.12/g.
• Nashville- $2.26/g, up 4.8 cents per gallon from last week's $2.22/g.
• Huntsville- $2.16/g, unchanged from last week's $2.17/g.
"Gas price increases continue to slow down as oil prices fail to continue moving upward, even as gasoline demand continues to show new signs of improving recovery," said Patrick De Haan, head of petroleum analysis for GasBuddy. "According to Pay with GasBuddy data, Friday gasoline demand was the highest since November, while Saturday gasoline demand was the strongest of any Saturday since the pandemic began. The rise in gasoline demand has certainly been behind oil's rally in the last few months, as COVID restrictions continue to ease and the economy slowly continues recovery. While the next few weeks may see gas prices rising slightly, the real pinch could come in March and lasting through summer, should demand continue on this path."
GasBuddy is the authoritative voice for gas prices and the only source for station-level data spanning nearly two decades. Unlike AAA's once daily survey covering credit card transactions at 100,000 stations and the Lundberg Survey, updated once every two weeks based on 7,000 gas stations, GasBuddy's survey updates 288 times every day from the most diverse list of sources covering nearly 150,000 stations nationwide, the most comprehensive and up-to-date in the country. GasBuddy data is accessible at FuelInsights.GasBuddy.com.
SOURCE GasBuddy


