Pent-up demand from the pandemic, low interest rates, and a shortage of properties have created a booming housing market with near record levels of refinance activity. While typical home values have increased by 15% from a year ago, the housing market is expected to stay hot in many cities through the end of the year and into next. According to the most recent loan-level mortgage data from the Home Mortgage Disclosure Act, there were 12.1 million mortgage loan applications approved in 2020 with an overall approval rate of 83.6%.
Mortgage loan approval rates vary by purpose of the loan. Refinancing applications for conventional, single-family loans without a cash-out option had the highest approval rate at 86.9%. Home purchase loans had a nearly identical approval rate at 86.3%, and cash-out refinancing applications were just slightly less likely to be approved, with an approval rate of 84.9%. In comparison to these types of loans, home improvement loans were the least likely to be approved—just 61% of home improvement loans were approved in 2020.
Mortgage application approval rates vary not only by purpose of the loan but also by demographic characteristics of the applicant, including race and ethnicity. Co-applicants of different races (“joint”) and non-Hispanic white applicants had the highest loan approval rates, both at 86.1%. Black, American Indian or Alaskan Native, and applicants of two or more minority races experienced the lowest approval rates, ranging from 65.8% to 69.4%. The loan approval rate for Hispanic or Latino applicants was 74.8%—a figure higher than that of other minority groups, but still 11 percentage points below the approval rate of white borrowers.
Differences in loan approval rates are in part due to varying credit profiles and application types across racial and ethnic groups. Members of minority groups are more likely to have lower incomes, lower credit scores, and live in economically disadvantaged neighborhoods. Still, research points to persistent discrimination in the lending market, and that even controlling for differences in financial health, minorities are denied loans at higher rates than their white counterparts.
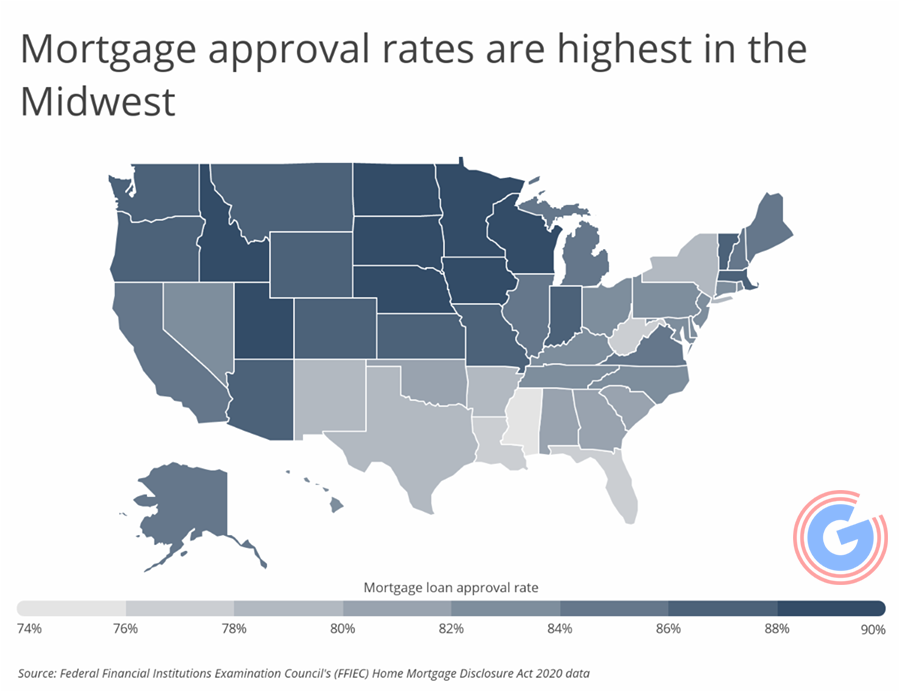
Approval rates are highest in the Midwest, while they tend to be lower in the South and Southeast. This is likely due to differences in local demographic makeup and socioeconomic status. At 90.6% and 90.1%, respectively, North Dakota and South Dakota residents experienced the highest loan approval rates in the country. At the other end of the spectrum, Mississippi and Florida residents faced the lowest loan approval rates, at just 74.7% and 77.1%, respectively.
To find the locations with the highest loan approval rates, researchers at Smartest Dollar analyzed the latest data from the Federal Financial Institutions Examination Council’s Home Mortgage Disclosure Act, the U.S. Census Bureau, and Zillow. The researchers ranked states according to the mortgage loan approval rate. Researchers also calculated the total loan applications approved, median home price, median household income, and minority population share—defined as the percentage of the population that is not non-Hispanic white.
The analysis found that in 2020, 83.0% of mortgage loans were approved in Tennessee, compared to 83.6% at the national level. Out of all U.S. states, Tennessee has the 20th lowest loan approval rate.
Here is a summary of the data for Tennessee:
- Mortgage loan approval rate: 83.0%
- Total loan applications approved: 235,945
- Median home price: $226,456
- Median household income: $56,071
- Minority population share: 26.7%
For reference, here are the statistics for the entire United States:
- Mortgage loan approval rate: 83.6%
- Total loan applications approved: 12,107,353
- Median home price: $287,148
- Median household income: $65,712
- Minority population share: 40.0%
For more information, a detailed methodology, and complete results, you can find the original report on Smartest Dollar’s website: https://smartestdollar.com/


