

MURFREESBORO, Tenn. — A sweeping nine-year analysis of marriage and divorce data reveals dramatic contrasts across Middle Tennessee, with several of the more rural counties posting some of the highest divorce-to-marriage ratios in the state — while urban Davidson County remains the lowest. WGNS gathered the numbers from data the Tennessee Department of Health with reports from county clerk offices and the Tennessee Office of Vital Records.

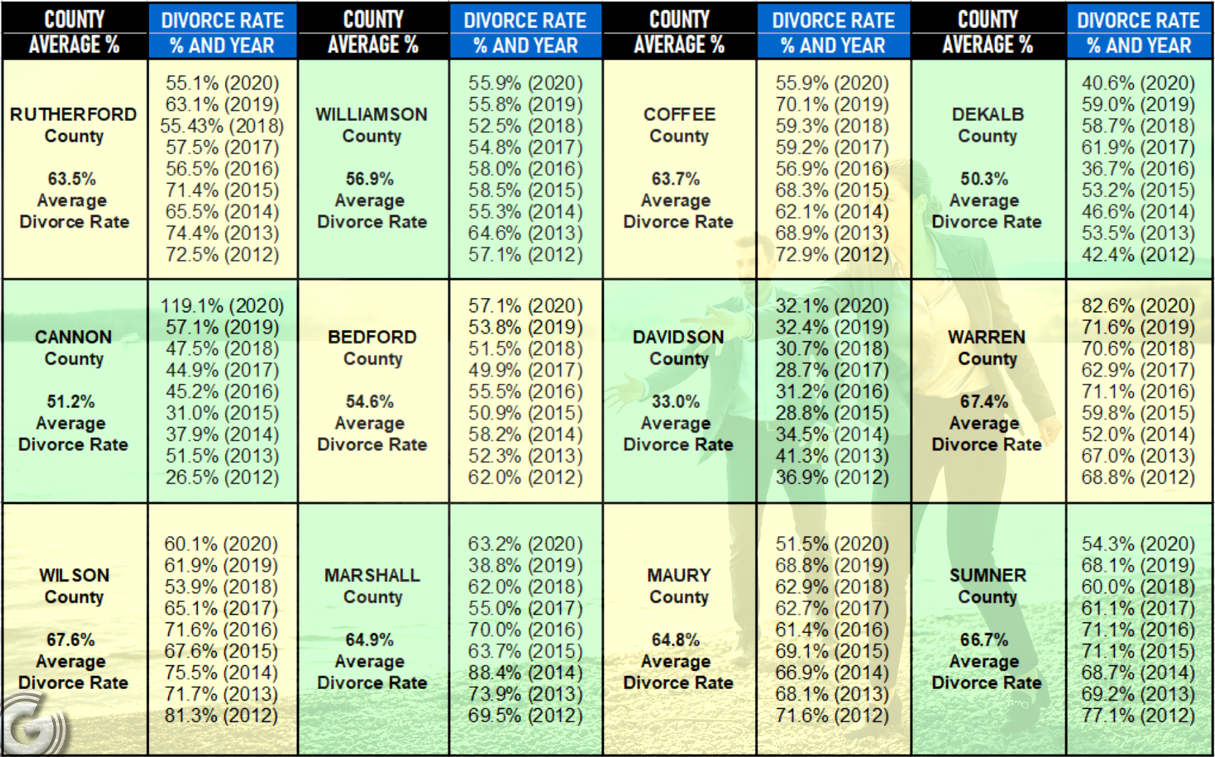
When all nine years are averaged together, Wilson County ranks as having the highest divorce rates among the counties studied in Middle Tennessee with a 67.6% divorce-to-marriage ratio, followed closely by Warren County at 67.4% and Sumner County at 66.7%. At the other end of the spectrum, Davidson County stands far below the regional norm with a long-term divorce average of just 33.0%, less than half the average of many surrounding counties.
Meanwhile, Rutherford County, which has led the region and the state in population growth during the study period, posted a nine-year average divorce rate of 63.5%, placing it 7th overall among the 12 counties analyzed, which unfortunately is well above the statewide average of 45.4%.
Divorce Rates in Counties Within an 15-Mile Drive of Murfreesboro Square: Every county within a 15-mile radius of the Murfreesboro Square had divorce rates that were significantly higher than our state’s capitol. But the closest county with the lowest rate was Cannon County, where there were 51 divorces for every 100 marriages during the years we examined. The second lowest number found within 15-miles of the historic square was Bedford County, which is just 14 miles south of the courthouse. There, roughly 55 divorces were filed for every 100 marriages during the same 9-year window.
Coming in at third place is Williamson County, where almost 57% of marriages collapsed between 2012 and 2020. The Williamson County line is a short 13-mile drive from the Murfreesboro square and it appears you’ll have to drive at least 5-miles further to see a real decrease in divorce court.
Moving a little further away from the heart of Murfreesboro appears to be good for the heart of marriages, because Nashville had the best scores in Middle Tennessee. The distance between the tip of the Davidson County line and downtown Murfreesboro is 18-miles, but the drive must be worth it. Davidson County recorded a 33% divorce rate in the 9-years of study.
Rutherford County’s 63.5% divorce rate compared to Davidson County’s 33.0% rate means that divorce is happening at nearly TWICE the frequency in Rutherford County when measured against the number of marriages recorded. Put simply, for every 100 marriages in Rutherford County, about 64 of those marriages ended in divorce during the study period. For every 100 marriages in Davidson County, only about 33 ended in divorce. Rutherford County sees about 31 MORE divorces for every 100 marriages than Davidson County couples see.
Excluding Davidson County, the average divorce rate across every county touching this 18-mile radius exceeds 58%, underscoring how relationship instability remains deeply embedded across the geographic heart of Middle Tennessee—even as population and development accelerate outward from Rutherford County.

Davidson County: Largest Population, Lowest Divorce Ratio: Although Davidson County is by far the most populated county in Middle Tennessee, it maintains the lowest long-term divorce-to-marriage ratio of the entire study at 33.0%.
Experts note that higher population density, younger median age, greater education levels, and a higher influx of new residents often change how marriage and divorce statistics behave in large metropolitan counties. Davidson’s lower ratio does not necessarily mean fewer divorces in raw numbers, but rather a much higher volume of marriages compared to rural areas, which drives the percentage downward.
In contrast, small counties frequently show divorce percentages exceeding 70% during individual years, where just a few dozen cases can dramatically alter the statistical picture. Also altering the photo, is the fact that our study does not account for those who began their marriage in one county and ended it in another.
Growth Meets Divorce: The Fastest-Growing Counties
During the 2012–2020 study period, population growth occurred fastest in:
- Rutherford County – Fastest Growing

- Wilson County – Second in Growth
- Williamson County – Third in Growth
- Davidson County – Fourth
What makes the data especially notable is that three of the four fastest-growing counties also rank among the highest for divorce-to-marriage ratios, especially when comparing the overall state average of divorce numbers. That statewide number, which includes numbers from all 95 counties, equals a 45.4%
average divorce rate during the 9-year span.
3 of the 4 Fastest Growing Counties Have Above Average Divorce Numbers:
- Rutherford County: 63.5% average
- Wilson County: 67.6% average (highest overall)
- Williamson County: 56.9% average
- Davidson County: 33.0% average (outlier)
This overlap reveals a powerful regional trend: growth does not reduce divorce rates—in many cases, it coincides with higher instability. Only Davidson County breaks that pattern due to its sheer scale, economic diversity, and demographic mix.
Regional Implications: The findings suggest Middle Tennessee’s rapid expansion—especially along the I-24, I-40, and I-840 growth corridors—has not resulted in lower marital turnover. Indicators instead point to signs of increased stress and sustained levels of family disruption.
Findings Show and/or Highlight Divorce Likely Happens More Frequent in Areas of:
- Rapid housing growth
- Job-driven migration
- Economic pressure
- Longer work commutes
- Health-care access disparities
- And rural financial strain
With Rutherford County alone, adding tens of thousands of residents over the past decade, local leaders, courts, schools, and social-service agencies continue to absorb both the economic boom and the social aftershocks that come with it.
Bottom Line
- Wilson, Warren, and Sumner Counties lead in long-term divorce frequency.
- Rutherford County’s growth has not translated into lower divorce impact.
- Every county within 18 miles of downtown Murfreesboro shows divorce averages well above state norms—except Davidson County.
- Statewide Tennessee average remains at 45.4%, far below most Middle Tennessee counties.
How This Compares to Middle Tennessee
For direct perspective:
- U.S. National Average (2012–2020): 37.2%
- Tennessee Statewide Average (your TN data): 45.4%
- Rutherford County Average: 63.5%
So compared to the national level:
- Tennessee runs about 8 percentage points higher than the U.S.
- Rutherford County runs about 26 percentage points higher than the U.S.
- That means Rutherford’s divorce-to-marriage ratio is nearly DOUBLE the national same-year ratio.
Real-World Example Using 1,000 Marriages
If 1,000 marriages occurred in the same year:
- United States average: ~372 divorces
- Tennessee average: ~454 divorces
- Rutherford County: ~635 divorces
So Rutherford County, TN alone would see about 263 more divorces than the national average for every 1,000 marriages in the same year.
Summary in Plain Terms
- The national same-year divorce-to-marriage rate averages about 37%.
- Tennessee consistently runs far higher than the nation.
- Most Middle Tennessee counties — especially Rutherford, Wilson, Warren, and Sumner — are dramatically above national norms.
| United States — Divorce to Marriage Percentages (Using Raw Counts) | |||
|---|---|---|---|
| Year | Marriages | Divorces | Divorce-to-Marriage % |
| 2020 | 1,676,911 | 630,505 | 37.6% |
| 2019 | 2,015,603 | 746,971 | 37.0% |
| 2018 | 2,132,853 | 782,038 | 36.7% |
| 2017 | 2,236,496 | 787,251 | 35.2% |
| 2016 | 2,251,411 | 776,288 | 34.5% |
| 2015 | 2,221,579 | 800,909 | 36.1% |
| 2014 | 2,140,272 | 813,862 | 38.0% |
| 2013 | 2,081,301 | 832,157 | 40.0% |
| 2012 | 2,131,000 | 851,000 | 39.9% |